Technology
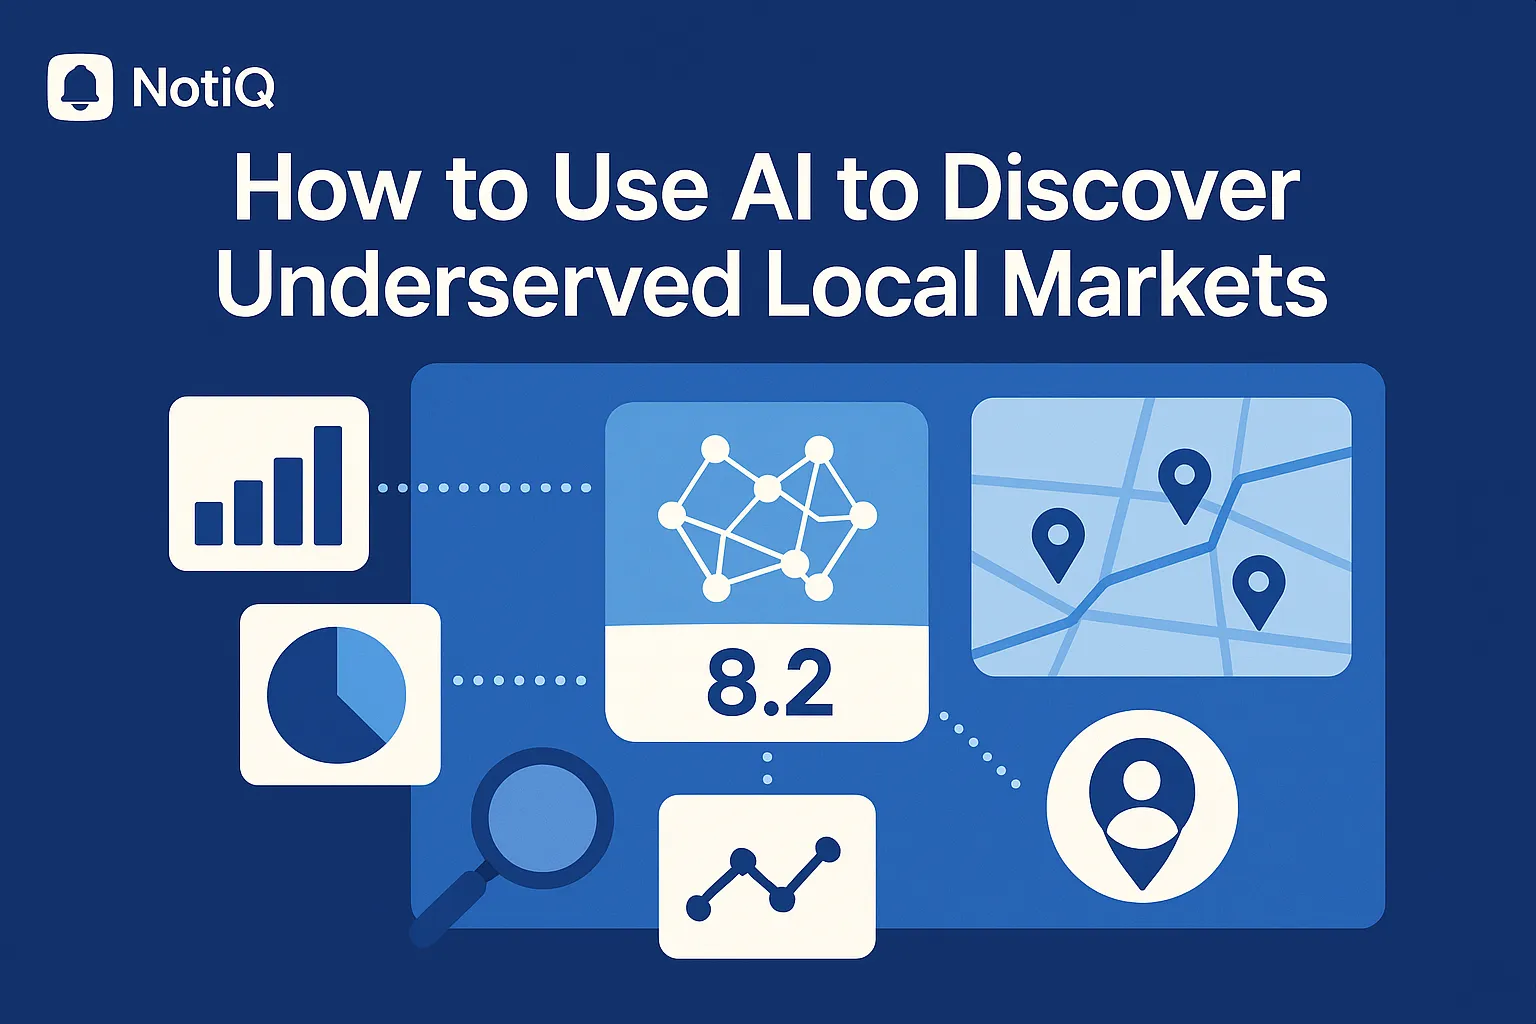
How to Use AI to Discover Underserved Local Markets
Learn how to use AI to uncover underserved local markets by analyzing demand, competition, reviews, and demographic fit. This guide shows a repeatable framework for scoring ZIP codes and prioritizing smarter expansion opportunities.
1. Introduction
Most growth teams know there is untapped local demand hiding within their target regions, but they consistently struggle to prove exactly which ZIP codes, neighborhoods, or commercial corridors are truly underserved. Relying on broad, city-level market research often obscures critical hyperlocal supply-and-demand gaps. Conversely, attempting to manually analyze search volume, map visibility, customer reviews, local demographics, and offline signals across hundreds of locations is simply too slow and fragmented to scale.
This guide provides a practical, repeatable framework for using AI market research for underserved local markets. By systematically aggregating and scoring diverse data signals, teams can rank local opportunities with far more confidence than by relying on search volume or population growth alone. Designed for advanced growth, strategy, local SEO, and expansion teams, this methodology delivers defensible prioritization rather than generic market research advice.
Crucially, this approach bridges the gap between local SEO research and traditional market analysis, unifying them into a single, AI-assisted scoring workflow. Drawing on NotiQ’s extensive experience in building compliant, AI-driven market discovery workflows, this article outlines a transparent methodology that avoids black-box conclusions and empowers teams with verifiable data. Readers looking to explore more research-driven workflow articles after this guide can visit Blog.
2. What Defines an Underserved Local Market
To execute effective market gap analysis, teams must first establish a precise definition of their target. It is a common mistake to conflate a “growing market” or a “high search volume market” with an “underserved market.” An underserved local market is defined by a distinct mismatch between customer demand and the availability, quality, accessibility, or fit of existing providers.
Being underserved does not exclusively mean a location has "low competition." A market can be heavily saturated with competitors but remain underserved due to poor service quality, weak customer reviews, low map visibility, inadequate geographic coverage, or a lack of specialized offerings. Furthermore, local market analysis must distinguish between city-level averages and true hyperlocal opportunities at the neighborhood, ZIP-code, or trade-area level.
To accurately identify these gaps, this guide utilizes a five-input model: search demand, review sentiment, competitor density, demographics, and offline local signals.
Demand-Supply Imbalance Is the Core Signal
The foundational logic of local opportunity scoring is identifying high consumer intent or need combined with weak supply, low quality, or poor market fit. Isolated indicators can easily mislead expansion teams. For example, robust search demand in an area lacking the necessary purchasing power is a weak opportunity. Similarly, a lack of competitors might simply indicate a lack of genuine local demand.
The most lucrative opportunities in consumer demand forecasting and competitive gap analysis emerge from these imbalances rather than from raw market size alone. By analyzing hyperlocal demand analysis data against existing supply, businesses can pinpoint exact locations where consumer needs are currently failing to be met.
Why Hyperlocal Granularity Matters
Strategic expansion decisions are rarely made at the city level; they require granular location intelligence focused on neighborhoods, ZIP codes, corridors, service radii, or specific trade areas. Competitor saturation, demand intensity, and consumer behavior can vary dramatically within the exact same metropolitan area.
Consider two neighborhoods in the same city: Neighborhood A might have rapid population growth but is already saturated with high-quality service providers, making entry expensive and difficult. Neighborhood B might have slower growth but features aging incumbent businesses with terrible online reviews and poor digital visibility, presenting a prime opportunity for a modern competitor. To support geospatial analytics and site selection analytics with reliable demographic and commuting data, teams should consult ACS business data for site selection.
Common Misreadings of “Underserved”
When utilizing local market research tools, teams must avoid equating "underserved" with narrow, single-metric definitions such as:
• Low competition only
• High population growth only
• High search volume only
• Weak SEO visibility only
Relying on a single metric often leads to false positives in small business opportunity analysis. This happens when teams overlook critical factors like poor service quality, a lack of income fit, operational roadblocks, or temporary, seasonal spikes in demand. Unlike narrower tools that focus on only one signal and fail to provide a holistic view of how to find market gaps in a city, a multi-signal AI workflow ensures a comprehensive assessment of true market viability.
3. The Data Signals That Reveal Local Demand Gaps
No single dataset is sufficient for advanced location intelligence and local market analysis. To build a reliable underserved-market hypothesis, teams must rely on multi-source evidence. The strongest ai competitor analysis for local markets combines online intent, local supply density, quality feedback, demographic fit, and offline activity into a unified perspective.
Search Demand and Local Intent Signals
Understanding where people are actively looking for solutions requires analyzing local keyword demand, service-intent queries, map-pack visibility, and SERP patterns. Crucially, search demand must be interpreted by specific geography, rather than relying on national keyword totals that obscure local nuances.
While local keyword research and search demand metrics are highly useful, local SEO market research data should be viewed as just one layer in the overall market score. For teams looking to integrate local search and content demand signals into their SEO-led market discovery,Blog provides valuable insights.
Competitor Density and Market Saturation
Mapping the number of incumbent providers by ZIP code, neighborhood, or trade area is a vital step in competitive gap analysis. However, competitor density alone paints an incomplete picture. Teams must also assess market concentration, specialization, and whether those incumbents are actually satisfying local demand.
Estimating market saturation requires comparing local supply against broader regional or national benchmarks. To support local establishment-count analysis, teams can reference the BLS QCEW guide to local industry concentration, and for a deeper understanding of concentration benchmarking, review the official explanation of location quotients.
Review Sentiment and Service-Quality Gaps
Customer reviews are one of the most powerful tools for identifying dissatisfaction-driven whitespace. High-demand markets where incumbent providers exist but consistently underperform are prime targets. By analyzing review sentiment for competitive intelligence, teams can uncover service quality gaps indicated by low average ratings, repeated complaints, unanswered reviews, slow service, poor availability, and inconsistent customer experiences. This qualitative layer is a major differentiator compared to rudimentary workflows that merely count competitors without assessing the quality of existing services.
Demographic and Economic Fit
Not all high-demand markets represent attractive expansion opportunities. If household income, business density, commute patterns, or the local customer mix do not align with the business offering, the market is not a fit. In site selection analytics and small business expansion market analysis, demographics should be utilized as a weighting factor rather than a strict pass/fail metric.
The necessary variables will differ significantly based on the business model. Local services, multi-location retail, franchises, and B2B regional plays should not rely on identical demographic assumptions. Teams should utilize the previously cited Census ACS business data to accurately map household, commuting, and segmentation variables to their specific operational models.
Offline and Alternative Local Signals
To distinguish visible online demand from real-world operational opportunity, teams must incorporate offline signals such as mobility data, footfall proxies, transaction signals, corridor activity, and access barriers. These trade area analysis inputs are especially valuable for physical site selection, defining service territories, and validating whether the local market infrastructure can actually support a new entrant. Utilizing geospatial AI for business expansion helps bridge the digital-physical divide. For methodologies on combining geographic data to map need and access constraints, refer to the Urban Institute's guide on mapping local need and access challenges.
4. An AI Workflow for Scoring ZIP Codes and Neighborhoods
The true power of ai market research lies in workflow orchestration and synthesis, not merely content generation. By transforming disparate signal categories into a practical, repeatable workflow, teams can generate a transparent market opportunity score rather than relying on an opaque, black-box model.
NotiQ is uniquely positioned as an AI-driven market discovery platform built specifically for repeatable underserved-market analysis and hyperlocal demand analysis. To see how NotiQ serves as the AI workflow orchestrator for aggregating signals, scoring locations, and producing detailed opportunity briefs, visit[Home](/).
Step 1 — Define the Market Unit and Use Case
Before gathering data, teams must choose the appropriate geographic unit for their local market analysis: a ZIP code, a specific neighborhood, a city submarket, a commercial corridor, or a defined service radius. The scoring model must directly reflect the business model—whether it is a local service business, a multi-location retailer, a franchise, or a B2B regional expansion. Teams must also define what "success" looks like for their site selection analytics and trade area analysis, whether that means lead generation, store visits, bookings, revenue potential, or establishing a strategic foothold.
Step 2 — Gather and Normalize Multi-Source Inputs
AI excels at ingesting fragmented, publicly accessible inputs from search demand, map listings, reviews, demographics, and offline proxies into a single, cohesive schema. Proper entity resolution, deduplication, and geographic normalization are critical to ensure that the same market can be compared consistently across different datasets. Poor data hygiene is the primary reason manual market research breaks down at scale; leveraging AI for location intelligence and geospatial analytics solves this bottleneck compliantly and efficiently.
Step 3 — Engineer Features That Reflect Real Opportunity
Raw data must be transformed into actionable indicators to facilitate accurate market gap analysis. AI can engineer features such as demand-per-competitor ratios, low-rating share percentages, service-quality gap scores, local intent intensity, and demographic fit scores. For example, rather than just counting competitors, feature engineering might calculate the ratio of high-intent search queries to businesses with a rating of 4.0 or higher. This ensures the competitive gap analysis captures quality gaps, not just quantity gaps, providing a truer picture for opportunity scoring.
Step 4 — Apply Weighted Scoring Logic
Once features are engineered, teams apply transparent, weighted scoring logic based on their specific business priorities to generate a market opportunity score. A local plumbing service may heavily weight review sentiment and service coverage, whereas a retail coffee chain will likely weight mobility, foot traffic, and consumer demand forecasting much higher. A standard scorecard structure might calculate:Demand Score + Competition Score + Quality Gap Score + Fit Score + Offline Confidence Score = Total Market Opportunity Score.
Step 5 — Use AI to Synthesize Market Briefs
Large Language Models (LLMs) and AI agents are then deployed to turn this structured data into concise market opportunity briefs for each location. AI workflows can automatically categorize outputs into groups such as “best-fit markets,” “high-risk markets,” “quality-gap opportunities,” and “watchlist markets.” In this stage of ai market research, AI is used to summarize evidence and highlight data patterns, complementing—rather than replacing—the underlying mathematical scoring framework.
Step 6 — Rank Markets and Set Go/No-Go Thresholds
The final step in the workflow is moving from a long list of potential locations to a prioritized shortlist. By ranking neighborhoods and executing ZIP code scoring, teams create a highly actionable territory leaderboard. Establishing strict go/no-go thresholds, confidence bands, and disqualification rules prevents teams from chasing weak or misleading signals. This structured market prioritization stands in stark contrast to manual, spreadsheet-heavy research or one-dimensional tools that force teams to stitch together SEO, local, and operational signals by hand.
5. How to Validate Opportunity and Avoid False Positives
The biggest hurdle in adopting AI for local market research is the fear of making confident but incorrect expansion decisions. Validation is absolutely mandatory to avoid false positives. Even when data suggests a strong opportunity, teams must verify that the demand is not seasonal, misleading, or operationally unviable before committing to entry.
Check for Temporary Demand Spikes vs Durable Gaps
AI models can sometimes misinterpret short-lived attention as long-term opportunity. Seasonality, local news events, extreme weather patterns, local infrastructure disruptions, or temporary competitor outages can artificially inflate a market score. Teams must validate demand in a local market by comparing data over multiple periods to ensure they are forecasting durable demand rather than temporary spikes. Seasonality checks are vital for accurate consumer demand forecasting.
Review the Local SERP and Map Pack Manually
Even the best AI scoring requires a human review of the local search results and map-pack dynamics. A manual SERP evaluation can uncover irrelevant competitors ranking for broad terms, map ranking anomalies, sparse directory listings, or misleading local-intent terms that skewed the initial data. In local SEO market research, visual map pack analysis often confirms or challenges the AI-generated demand-supply story.
Validate with Review Mining and Quality Audits
To validate service quality gaps, teams must read beyond the aggregate star ratings. Review mining allows teams to uncover repeated complaints, service delays, pricing frustrations, low responsiveness, and unmet niche needs. By segmenting review sentiment by specific locations and competitor types, teams can turn a hypothetical data gap into a concrete, evidence-based market-entry thesis.
Pressure-Test Demographic and Operational Feasibility
An area may appear underserved online, but teams must pressure-test whether the target customer profile exists at a sufficient density and if the market is operationally feasible to serve. Real-world filters for location intelligence include pricing fit, service radius constraints, staffing availability, logistics, and local physical accessibility. Demographic fit is crucial; some areas are "underserved" for structural, economic reasons, making them poor targets for expansion.
Add Governance and Risk Controls to AI Scoring
Scoring neighborhoods or ZIP codes with AI requires strict governance, particularly when using data proxies that may introduce bias or overconfidence. Human review must always have the authority to override automated suggestions. Documenting assumptions, data weights, and validation rules ensures the scoring validation process remains fully auditable. For trustworthy AI implementation, teams should align their workflows with the NIST AI Risk Management Framework.
6. How Teams Turn Market Scores Into Expansion Priorities
The ultimate value of AI market research is not just insight generation, but strategic market prioritization. By bridging the analytical workflow to actionable business expansion market analysis, teams across various departments can make faster, more defensible decisions.
For Growth and Strategy Teams
Growth and strategy teams utilize opportunity scoring to decide precisely where to launch, test, partner, or allocate capital budget. Ranked local markets provide a highly defensible roadmap for strategic prioritization, replacing gut intuition with empirical evidence. Teams can easily segment their market expansion shortlist into actionable categories: immediate entry, pilot markets, and locations to monitor for later.
For Local SEO and Content Teams
Underserved-market analysis is not just for physical operations; it is a goldmine for local content strategy. Local SEO market research scores guide teams on where to build local landing pages, develop neighborhood-specific content, expand digital service areas, and capture high-intent search demand by geography. By tying search-demand gaps directly back to local SERP capture, content teams can dominate underserved digital spaces. For more on applying AI research workflows to SEO and market discovery, visit Blog.
For Operations and Territory Planning
Opportunity scores directly support territory planning, service area analysis, and trade area analysis. Operations teams use these insights to design efficient service routes, set staffing priorities, optimize service coverage, and sequence market rollouts. However, practical trade-offs must be made: a high-potential market might still be deprioritized if the local delivery economics, logistics, or coverage constraints prove too weak to support execution readiness.
Build a Repeatable Opportunity Scorecard
To institutionalize this process, teams should build a repeatable opportunity scorecard that can be updated as local conditions evolve. A robust market scoring model should include clear categories: Market Unit, Demand Score, Competition Score, Quality Gap Score, Demographic Fit, Offline Confidence, Risk Flags, and Recommended Action. By establishing this repeatable workflow, teams leverage the distinct advantages of AI enrichment, verification, and cross-source synthesis—closing the exact gaps that traditional competitor analysis leaves wide open.
7. Future Trends in AI Market Discovery for Local Expansion
Local market research is rapidly evolving from static, descriptive analysis to predictive local opportunity scoring and dynamic market simulation. As geospatial AI for business expansion matures, teams are adopting advanced use cases like AI-generated local market briefs, geospatial clustering, automated review theme modeling, and integrated online/offline signal monitoring. The future of AI market research lies in unifying SEO, expansion, and territory planning into a single, cohesive strategic motion.
From Static Research to Continuous Market Monitoring
Local opportunities are never static; they fluctuate constantly due to new competition, shifting consumer demand, and changes in incumbent service quality. The most effective expansion teams treat underserved-market discovery as an always-on process of continuous market monitoring. By utilizing location intelligence to set up market opportunity alerts, businesses can strike the moment a competitor's service quality drops or local demand spikes.
Why Unified Workflows Will Outperform Siloed Tools
Relying on a disjointed tech stack of standalone SEO tools, separate geospatial platforms, and traditional market research software leaves teams with a fragmented view of the market. Unified AI workflows provide a massive strategic advantage by combining discovery, scoring, validation, and synthesis into one seamless system. Platforms that automate market research automation and location intelligence software integrations will consistently outperform siloed tools. To explore a platform built specifically for unified market discovery workflows, visit[Home](/).
8. Conclusion
Finding truly underserved local markets requires far more than checking search volumes or counting map listings. It demands a multi-signal workflow that evaluates search demand, review sentiment, competitor density, demographics, and offline local signals in unison. AI market research for underserved local markets is most powerful when it unifies, scores, and synthesizes these fragmented datasets into a transparent, defensible market opportunity score.
However, AI is an enabler, not a replacement for human judgment. Rigorous validation remains the critical difference between identifying a lucrative market gap and falling for a costly false positive. By building and continuously refining a repeatable market opportunity scorecard, expansion, SEO, and strategy teams can confidently prioritize their next moves. NotiQ’s research-driven approach to AI market discovery workflows ensures this process is repeatable, transparent, and highly actionable across all cross-functional growth teams.
Frequently Asked Questions
- How can AI identify underserved local markets more effectively than traditional market research?
- AI market research does not replace sound research logic; rather, it exponentially speeds up the aggregation and synthesis of massive, multi-source datasets. Unlike traditional market research, which is often slow and manual, AI ensures comprehensive coverage, repeatability, and the ability to rank hundreds of underserved local markets simultaneously based on transparent criteria.
- What data signals are most useful for finding local demand gaps?
- The most reliable location intelligence relies on five core categories: search demand/local intent, competitor density/saturation, review sentiment/quality gaps, demographic/economic fit, and offline mobility/activity signals. The "best" combination of signals for finding local demand gaps will always vary depending on your specific business model and geography.
- How do you measure competition saturation in a local market?
- Measuring competition saturation goes beyond simple competitor density. It involves assessing market concentration, evaluating the actual quality of incumbents through review sentiment, and benchmarking local supply against broader regional norms. Using location quotients can also help determine if a specific industry is over- or under-represented in a target ZIP code.
- How do you validate demand before entering a new local market?
- To validate demand in a local market and avoid false positives, teams must conduct a multi-step market validation process. This includes checking for seasonality, manually reviewing the local SERP and Map Pack, mining reviews for qualitative gaps, and pressure-testing demographic fit and operational feasibility. AI outputs should always be reviewed by humans before making high-stakes financial decisions.
- Can this workflow work for local services, retail, franchises, and B2B regional expansion?
- Yes, this business expansion market analysis workflow is highly adaptable. However, the scoring weights and success metrics must be customized for each model. For example, a local service business might prioritize review sentiment and online search intent, while site selection analytics for retail or franchises will place a much heavier emphasis on foot traffic, mobility data, and demographic income fit. Small business opportunity analysis in B2B might focus heavily on local business density and account proximity.
Continue Reading
More articles you might find useful
Google Maps Prospecting for Commercial Waste Management Companies
Learn how commercial waste haulers can use Google Maps to find, qualify, and prioritize better local accounts. This guide shows how to build denser routes and improve outreach with waste-stream and service-area insights.
Read the article →
How to Find Local Businesses With Broken Website Links
Learn how to find local businesses with broken website links using Google Maps, quick validation checks, and proof-based outreach. This guide shows agencies how to turn visible site issues into qualified leads.
Read the article →
Google Maps Lead Generation for Signage Companies
Learn how sign companies can use Google Maps to find local prospects, identify visible signage gaps, and build a repeatable outreach system. This guide shows how to turn visual research into qualified leads without relying on paid ads or generic lists.
Read the article →Popular industry lead playbooks
Maps search examples and niche outreach for the verticals teams prospect most.