Technology
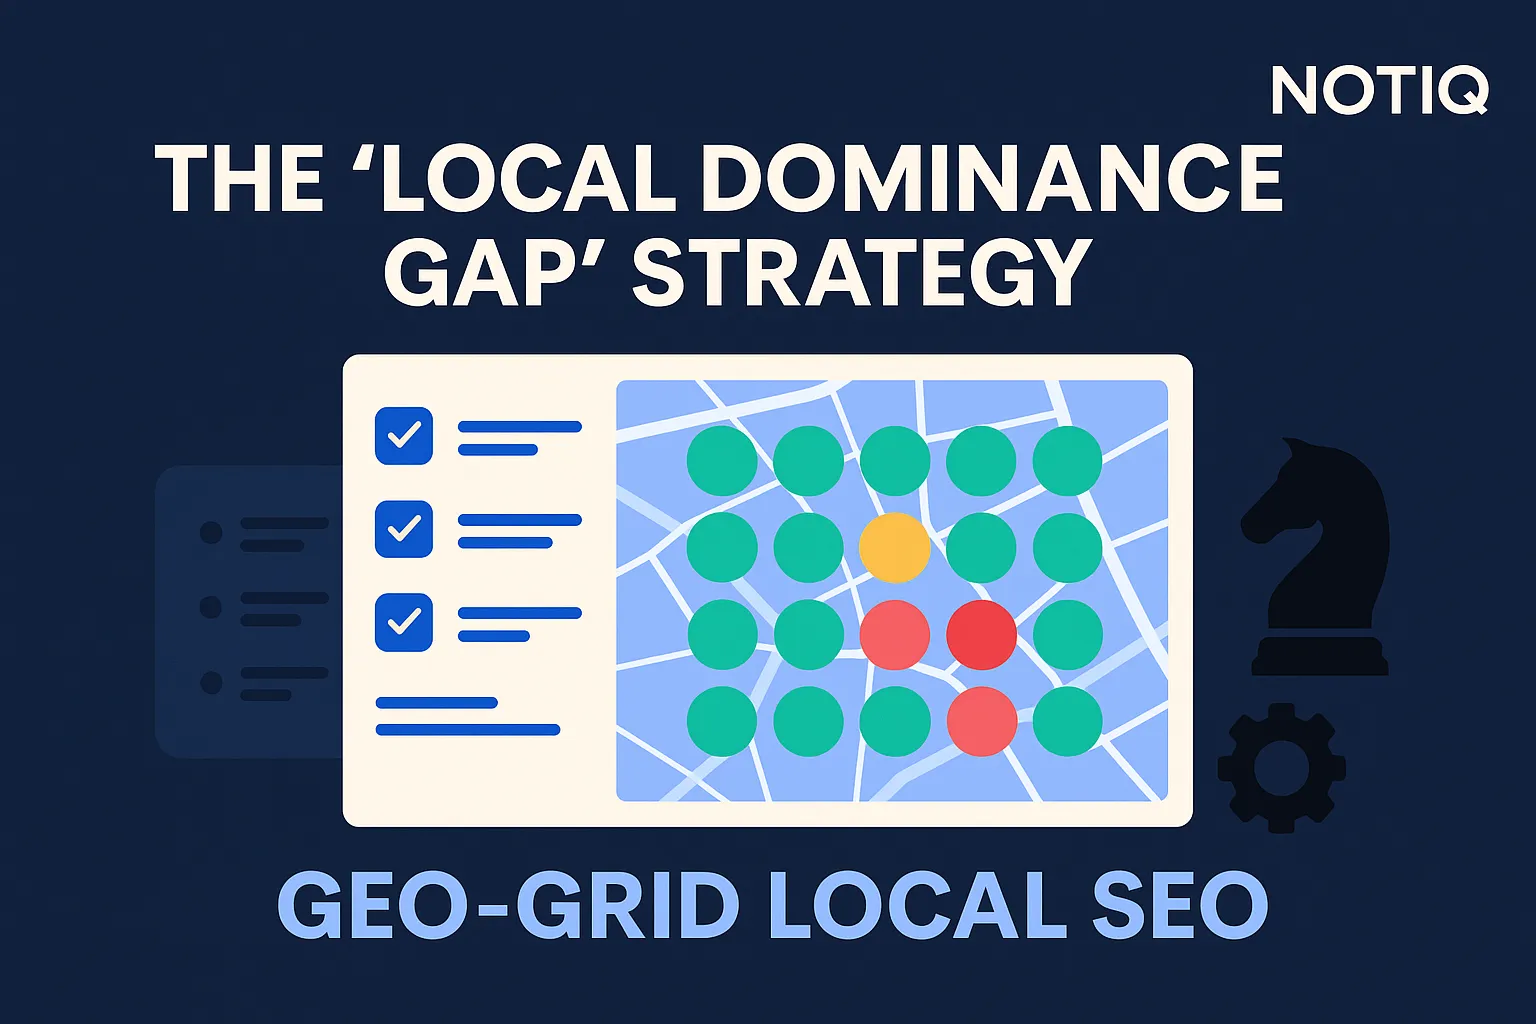
The “Local Dominance Gap” Strategy Using Maps Rankings
Learn how the Local Dominance Gap strategy uses geo-grid tracking to uncover hidden weak zones in Google Maps. This guide shows how to diagnose ranking issues and prioritize the fixes that grow local visibility.
1. Introduction
Here is the uncomfortable truth for advanced local SEO teams: a business can appear to “rank well” in Google Maps while silently losing high-value neighborhoods across the exact same city.
Average citywide rankings and manual spot checks often hide a neighborhood-level visibility collapse. This creates a dangerous disconnect between perceived market coverage and actual local market control. For multi-location brands and service-area businesses, relying on a single ranking snapshot from the business address provides false confidence.
Enter the “Local Dominance Gap.” This branded concept is not just a reporting metric—it is a strategic operating model designed to diagnose weak zones and assign the precise SEO action required to reclaim them. This framework shifts focus from vanity metrics to true market penetration.
This guide details how to identify ranking gaps using geo-grid tracking, isolate whether your core issue stems from proximity, relevance, or prominence, and prioritize fixes based on lead and revenue potential. As a strategic intelligence layer, NotiQ turns these raw Google Maps rankings into automated reporting, opportunity detection, and rigorous action planning.
2. What the Local Dominance Gap Really Means
The Local Dominance Gap represents the critical difference between perceived local visibility and actual neighborhood-by-neighborhood control in Google Maps and the local pack. It is a strategic framework that goes far beyond raw rank reporting.
Many teams operate with a “we rank in the city” mentality. However, block-level or zip-level reality often tells a different story, particularly for service-area businesses and multi-location brands. Branded searches, queries executed near the physical business address, and city-average ranking snapshots create false confidence. You may hold the #1 spot at your headquarters, but effectively disappear three miles away in your most profitable service corridor.
As an operating model, identifying the Local Dominance Gap requires a specific workflow: pinpoint weak zones, diagnose the root causes, estimate the commercial value of the gap, and assign the correct next SEO action. It is also vital to distinguish local pack visibility from traditional organic local rankings; while they share ranking signals, map pack rankings require separate, spatial analysis because distance and entity prominence play a much heavier role.
Experienced agency practitioners know that misreading “good rankings” is a common pitfall when teams only review average positions or branded checks. To build a more resilient local dominance maps strategy, teams must adopt a broader strategic workflow Blog that treats location data as business intelligence.
Why average rankings create strategic blind spots
Average rankings flatten performance variance across a service area. A business may dominate the immediate blocks surrounding its address while disappearing entirely in profitable outer zones. Because average metrics smooth out these extremes, they obscure the reality of the map. Neighborhood-level visibility matters exponentially more than vanity averages because localized presence directly dictates lead generation. If your Google Maps rankings average out to position 4, but you are position 1 at the office and position 15 where your ideal customers live, the average is actively misleading you.
The difference between a metric and an operating model
Heatmaps and rank scans alone are merely diagnostic inputs, not a local SEO strategy in themselves. The framework becomes valuable only when it is tied to prioritization, root-cause diagnosis, and execution. While many tool-centric reporting dashboards stop at showing you a colorful grid, an operating model demands that you understandwhylocal search competitors are winning specific intersections, and what operational steps are required to close that gap.
4. How to Diagnose Proximity, Relevance, and Prominence Issues
Discovering a weak zone is only the first step; turning that discovery into root-cause analysis requires applying Google’s local ranking framework. Poor rankings in weak cells are not all caused by the same issue, meaning generic SEO fixes often waste time and budget.
Diagnosis must be structured around the three core local factors: proximity, relevance, and prominence. As outlined in Google’s local ranking factors, these pillars dictate local visibility. Geo-grid patterns often hint at the underlying cause before a team even begins to audit the profile, reviews, landing pages, or citations. For example, being "strong near HQ but weak outward" suggests a different root cause than being "weak almost everywhere despite a central location."
Remember that local pack movement and organic local movement may not align perfectly, as Google Maps rankings weigh proximity far more heavily than traditional organic results.
Diagnosing proximity problems
The classic proximity pattern is unmistakable: strong map pack rankings close to the business location that suffer a rapid, uniform decline as the distance increases. Before taking action, teams must clarify whether this reflects legitimate geographic constraints—Google simply prioritizing closer businesses—or an under-optimized service area SEO strategy. Some proximity limitations cannot be fully “SEO’d away.” Expectation-setting is vital; if a competitor is physically located in a neighborhood, outranking them from five miles away requires an overwhelming prominence advantage.
Diagnosing relevance problems
Relevance problems manifest when a business fails to match the user's specific search intent. Weak category alignment, incomplete service menus, poor media signals, and thin local landing pages severely reduce relevance. If a business shows keyword-specific weakness—ranking well for "plumber" but failing for "water heater installation" in the exact same grid—this indicates a content or GBP alignment gap, not a distance issue. Practitioners must ensure strict adherence to Google Business Profile guidelines regarding category selection and service areas. Additionally, reinforcing on-site relevance through LocalBusiness structured data guidance ensures Google connects the local landing page to the entity's service offerings.
Diagnosing prominence problems
Prominence refers to how well-known and authoritative a business is. Review volume, review velocity, brand awareness, local links, citations, and engagement signals directly influence visibility in weaker zones. If local search competitors dominate outer neighborhoods despite being farther away from the searcher, it often reflects stronger market recognition rather than proximity. Prominence is a measure of who Google trusts as the most authoritative local entity, and improving it requires off-profile authority building and aggressive GBP optimization to boost local pack visibility.
Using competitor overlays to isolate the real cause
Comparing multiple businesses across the same geo-grid tracking setup reveals whether a zone is structurally difficult to rank in, or simply underserved by your brand. If a competitor is winning a zone you are losing, it signals they have better relevance alignment, stronger review profiles, or superior local authority. This hyperlocal overlap analysis is far more actionable than broad, city-level local SEO competitor analysis, which misses the nuances of block-by-block turf wars.
5. How to Prioritize Gaps by Lead and Revenue Potential
Not every weak zone deserves equal effort. Some grid cells may represent low commercial value, low population density, or low conversion intent. Moving from diagnosis to business-value prioritization ensures teams know exactly which ranking gaps to fix first.
Prioritization should be based on lead density, service profitability, competitor strength, and current local pack visibility. By scoring weak zones, agencies create a strategic action queue rather than a scattered list of vague SEO tasks. This business-impact layer transforms the local dominance maps framework into a highly strategic local SEO strategy, allowing agencies to justify roadmap decisions, allocate resources efficiently, and drive upsells based on revenue potential.
Scoring weak zones by commercial opportunity
To score a weak zone, combine the severity of the visibility weakness with local demand and service value. Dimensions to evaluate include population and business density, target customer concentration, average deal value, and route feasibility for service area SEO. Utilizing geographic demand inputs like ACS business demographic data helps quantify the true value of a neighborhood. Simple scoring systems (e.g., High/Medium/Low value) are highly effective; avoid false precision, but ensure you are targeting areas that actually generate revenue.
Factoring in competitor strength and effort required
Some ranking gaps are easy wins, while others are fiercely defended by entrenched local search competitors with massive prominence signals. Effort, timeline, and likely upside must influence your prioritization matrix. A zone dominated by a competitor with 500+ reviews and deep local links will take months to crack. Conversely, identifying “high-value, medium-effort” zones where competitors have weak profiles provides practical early targets for improving Google Maps rankings. Thorough local SEO competitor analysis prevents teams from wasting budget on unwinnable battles.
Building a prioritization matrix for agencies and multi-location teams
A repeatable prioritization framework evaluates four pillars: gap size, revenue upside, competitive pressure, and remediation complexity. This matrix supports quarterly planning, client reviews, and expansion decisions. For multi-location brands, benchmarking ranking gaps across dozens of branches highlights which markets are underperforming relative to their local dominance maps potential, allowing enterprise local SEO strategy to scale efficiently.
6. How to Turn Maps Insights Into Repeatable Local SEO Actions
Diagnosis and prioritization must translate into targeted implementation. The right fix depends entirely on the pattern uncovered in the geo-grid; there is no one-size-fits-all checklist.
Actions must be organized by the root cause: GBP optimization, review growth, landing page refinement, citation consistency, local link acquisition, and competitor-informed content expansion. Every action must be tied to a specific weak zone or keyword cluster. This is a repeatable workflow Home designed for operational teams, ensuring that service area SEO efforts are surgical rather than scattered.
GBP improvements that support weak-zone recovery
Category refinement, complete service menus, accurate business information, media enrichment, and attribute alignment strengthen relevance signals. Profile changes must reflect actual business operations and remain strictly compliant with Google’s terms. By connecting specific GBP optimization tasks to specific geography gaps—such as adding a localized service description to target a weak neighborhood—practitioners can directly influence Google Maps rankings and local pack visibility.
Review growth as a prominence lever
Review quantity, freshness, and topical relevance are massive prominence levers that support movement in highly competitive zones. Review acquisition must be operationalized, focusing on consistent cadence and locality signals (e.g., customers mentioning the specific neighborhood or service). While reviews elevate the entire profile's proximity and prominence, acquiring reviews from customers locatedwithinthe weak zones can send hyper-local signals that improve Google Maps rankings in those specific grid cells.
Local landing pages and service-area refinement
When weak keyword and geography combinations are identified, new or improved localized pages are often justified. Service-area pages reinforce relevance when they are aligned to actual offerings and user intent. Content depth, local proof (such as embedded reviews from that city), service specificity, and clear entity structure are required. A strong local SEO strategy ensures that the local landing page provides the exact relevance signals needed to support local pack visibility in the target zone.
Citations, local links, and entity reinforcement
Off-profile signals strengthen local authority and prominence. Local links and citations should focus on consistency, legitimacy, and local relevance rather than sheer volume. If a competitor overlay reveals that a rival has an authority advantage in a specific zone, acquiring links from hyper-local organizations, sponsorships, or news outlets within that community can bridge the gap. This entity reinforcement is critical for overpowering entrenched local search competitors.
Turning gap analysis into reporting, retention, and upsell workflows
Agencies must turn local dominance maps into compelling client narratives: what changed, why it matters, and what action comes next. Recurring scans, competitor snapshots, and action summaries form the backbone of retention and expansion conversations. Unlike static dashboards that stop at measurement, an orchestration layer like[Home](/)translates these ranking gaps into automated alerts, summaries, and repeatable local SEO reporting narratives that prove ROI.
7. Case Studies / Real-World Examples
To ground this framework, consider how advanced practitioners interpret geo-grid tracking patterns in the real world. Interpretation changes based on context, and identifying ranking gaps is only useful if it leads to a targeted action plan for Google Maps rankings.
Case Study 1 — Strong at the center, weak in outer neighborhoods
Pattern: A plumbing business ranks in the top 3 within a two-mile radius of its headquarters but fades sharply to position 15+ across profitable outer cells.
Diagnosis: This indicates a mix of natural proximity limits and underdeveloped service-area relevance. The business is relevant enough to rank nearby, but lacks the prominence and specific geographic relevance to push its map pack rankings outward.
Action Plan: Prioritization focuses on the highest-value weak zones first. The team executes targeted service area SEO: updating the GBP service areas, building dedicated location pages with hyper-local proof for the outer neighborhoods, and launching a review campaign specifically targeting customers in those zip codes to stretch the proximity and prominence signals.
Case Study 2 — Patchy visibility despite a central location
Pattern: An HVAC contractor exhibits a "checkerboard" local pack heat map. They rank #2 in one neighborhood, #9 in the adjacent block, and #4 slightly further away, showing inconsistent rankings despite a central location.
Diagnosis: Patchy visibility usually points to relevance and prominence issues, not distance. Competitor overlap analysis reveals that specific local search competitors are dominating the weak patches due to higher review velocity and hyper-specific GBP categories.
Action Plan: The strategy shifts to GBP optimization and authority building. The team refines primary and secondary categories, enriches the profile with specific service attributes, and executes a localized link-building campaign to build the broad entity authority required to stabilize rankings across the board.
8. Tools & Resources for Local Dominance Analysis
Executing this methodology requires more than a standard Google Maps ranking tracker. Measurement, competitor comparison, market context, and reporting workflows must all integrate seamlessly. The true differentiator for an agency is strategic synthesis, not merely collecting more data points.
Core inputs for the framework
The operational inputs required for this model include: geo-grid tracking scans, GBP audit data, review sentiment and velocity analysis, local SEO competitor analysis, localized landing-page audits, and business opportunity data. Each input supports a different stage of the ranking gaps model—from initial discovery to root-cause diagnosis, and finally to commercial prioritization. GBP optimization cannot happen in a vacuum; it requires these inputs to be synthesized.
Where NotiQ fits in the stack
NotiQ operates as the strategic intelligence and orchestration layer that turns raw geo-grid findings into action summaries, outreach triggers, and recurring reports. For agencies and multi-location teams,[Home](/)provides workflow leverage. By utilizing AI enrichment, verification, and strategic synthesis, NotiQ goes beyond pure rank tracking. It transforms local dominance maps into a decision-making engine, allowing teams to automate the heavy lifting of local SEO reporting and focus on executing the local SEO strategy.Home
9. Future Trends & Expert Predictions
Local SEO intelligence is evolving rapidly. The growing use of geo-grid visualizations, AI-assisted interpretation, entity signals, and review velocity monitoring is reshaping service area expansion strategies. The next competitive edge is not just collecting map data, but converting it into faster diagnosis and more defensible prioritization.
From dashboards to decision systems
Local SEO teams are moving away from passive local SEO reporting and toward proactive gap detection. Automated summaries and workflow triggers reduce analysis bottlenecks, allowing agencies to immediately spot ranking gaps and deploy fixes. The future belongs to decision systems that interpret geo-grid tracking data and instantly recommend the next operational step.
Why neighborhood-level intelligence will matter more
As market competition and map volatility increase, the value of cell-level insights will skyrocket. Brands relying on city-level averages will increasingly miss revenue-rich blind spots. Hyper-local local pack visibility and precise Google Maps rankings will dictate who captures local demand, making local dominance maps an indispensable tool for multi-location dominance.
10. Conclusion
The Local Dominance Gap is the critical difference between seeming visible on paper and truly controlling the map across the neighborhoods that generate revenue. To master this, teams must adopt a rigorous workflow: use geo-grid tracking to surface hidden weak zones, diagnose whether the root cause is proximity, relevance, or prominence, score the opportunity by actual business value, and deploy targeted local SEO actions.
The real advantage lies in translating the heatmap into prioritization, competitor intelligence, and repeatable reporting. Agencies and multi-location teams must operationalize this framework rather than relying on broad ranking averages. As a local SEO intelligence layer, NotiQ helps teams turn ranking gaps into opportunity scoring and automated reporting workflows, ensuring your local SEO strategy is always driving measurable growth. Explore a demo of workflow-driven local SEO intelligence today.Home
Frequently Asked Questions
- What is a Local Dominance Gap in Google Maps rankings?
- The Local Dominance Gap is the discrepancy between perceived citywide visibility and actual neighborhood-level coverage across a service area. It is most effective when utilized as a diagnosis-and-action framework for improving local dominance maps and Google Maps rankings, rather than just a passive reporting metric.
- How do you identify ranking gaps across a service area?
- Ranking gaps are identified using geo-grid tracking and heat maps, which provide visibility snapshots from multiple coordinates. This reveals weak cells and zones controlled by competitors. Repeated scans and competitor benchmarking are essential for context and tracking recovery.
- What factors affect Google Maps rankings the most?
- According to Google’s local ranking factors, the three primary pillars are relevance, distance (proximity), and prominence. GBP completeness, review velocity, local links, and local landing-page alignment act as the foundational signals that support these broader proximity and prominence factors.
- How often should businesses benchmark Maps rankings against competitors?
- Benchmarking frequency should be based on campaign intensity, market volatility, and reporting needs. A one-size-fits-all frequency is ineffective; recurring scans are necessary because one-off snapshots fail to capture trend analysis, making local SEO competitor analysis and retention reporting difficult for a Google Maps ranking tracker.
- When should a business create new location or service-area pages to close ranking gaps?
- New or improved pages should be created when weak zones map to clear service-intent patterns and represent true business coverage. Teams must avoid creating doorway pages without operational relevance. All local SEO strategy and service area SEO efforts must align with Google Business Profile guidelines to ensure compliance and avoid penalties.
Continue Reading
More articles you might find useful
Google Maps Prospecting for Commercial Waste Management Companies
Learn how commercial waste haulers can use Google Maps to find, qualify, and prioritize better local accounts. This guide shows how to build denser routes and improve outreach with waste-stream and service-area insights.
Read the article →
How to Find Local Businesses With Broken Website Links
Learn how to find local businesses with broken website links using Google Maps, quick validation checks, and proof-based outreach. This guide shows agencies how to turn visible site issues into qualified leads.
Read the article →
Google Maps Lead Generation for Signage Companies
Learn how sign companies can use Google Maps to find local prospects, identify visible signage gaps, and build a repeatable outreach system. This guide shows how to turn visual research into qualified leads without relying on paid ads or generic lists.
Read the article →Popular industry lead playbooks
Maps search examples and niche outreach for the verticals teams prospect most.